Introduction
Grafana is an open-source analytics and visualization platform used to monitor and analyze data from various sources. It provides a flexible and customizable interface for creating and displaying real-time dashboards, graphs, and charts. Grafana supports a wide range of data sources, including databases, time-series databases like Prometheus and InfluxDB, cloud monitoring services, and more.
With Grafana, users can connect to their data sources, configure queries, and create visualizations to gain insights into their data. It offers a rich set of features, such as interactive and drill-down dashboards, alerting and notification mechanisms, templating and variable support, and the ability to share dashboards and collaborate with others.
Grafana is widely used in the field of DevOps and infrastructure monitoring, as well as for visualizing business metrics, IoT data, application performance, and more. Its extensible nature allows users to enhance its capabilities by adding plugins and integrations with other tools and services.
Overall, Grafana is a powerful tool for data visualization and monitoring, helping users make informed decisions based on the analysis of their data.
In this post, We will know how to install Grafana 10 OSS on ubuntu 22.04 LTS.
Step 1: Update the System
Open a terminal by pressing Ctrl+Alt+T, Update the package lists by running the command:
sudo apt-get update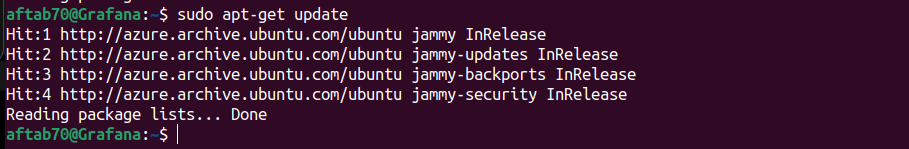
Step 2: Install Dependencies
Grafana required some packages, We need to install the dependencies by using the following command.
sudo apt-get install -y adduser libfontconfig1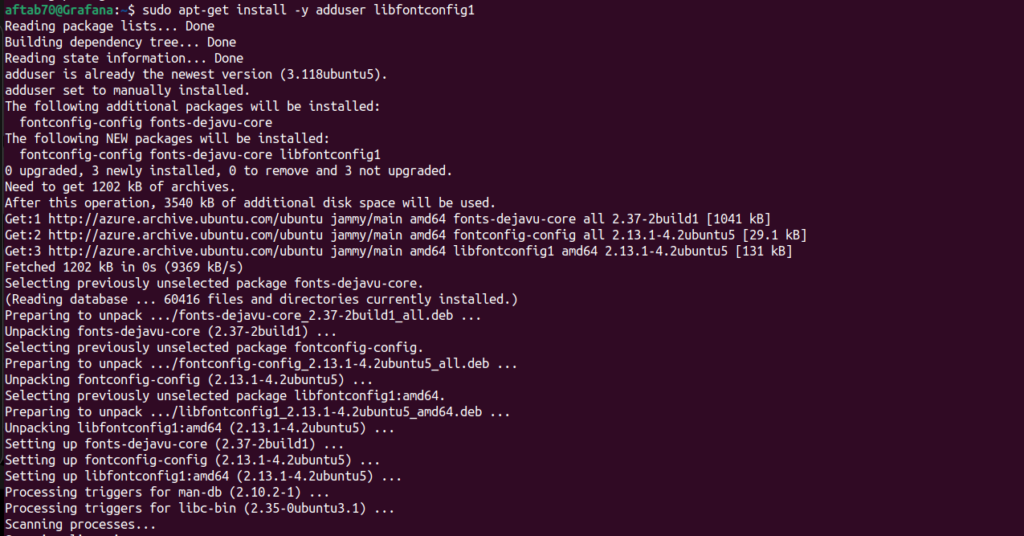
Step 3: Download Grafana .deb
We need to download the grafana_10.0.1_amd64.deb file by following the given command.
wget https://dl.grafana.com/oss/release/grafana_10.0.1_amd64.deb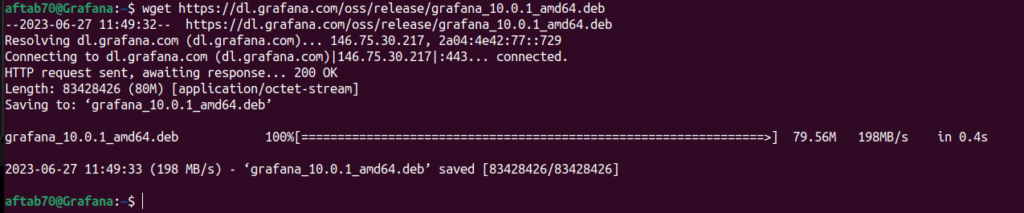
Step 4: Installing Grafana 10
We need to use the following command to install Grafana 10.0.1.
sudo dpkg -i grafana_10.0.1_amd64.deb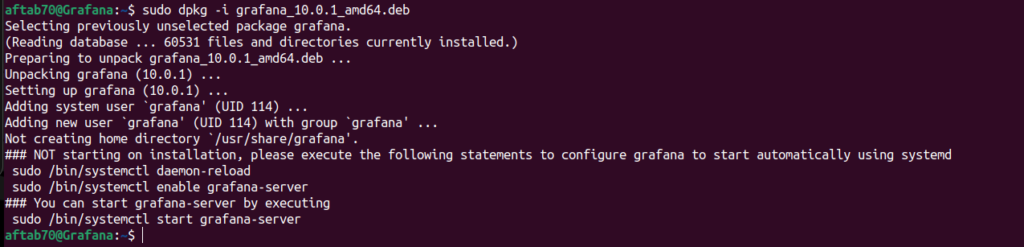
Step 5: Start the Grafana Service
We need to verify and start the Grafana service status its up or not, We need to use the systemctl to get service grafana status, Use the following command for the same.
sudo systemctl start grafana-server.service
Step 6: Verify the Grafana Service
We need to use given command to validate the grafana service using systemctl command.
sudo systemctl status grafana-server.service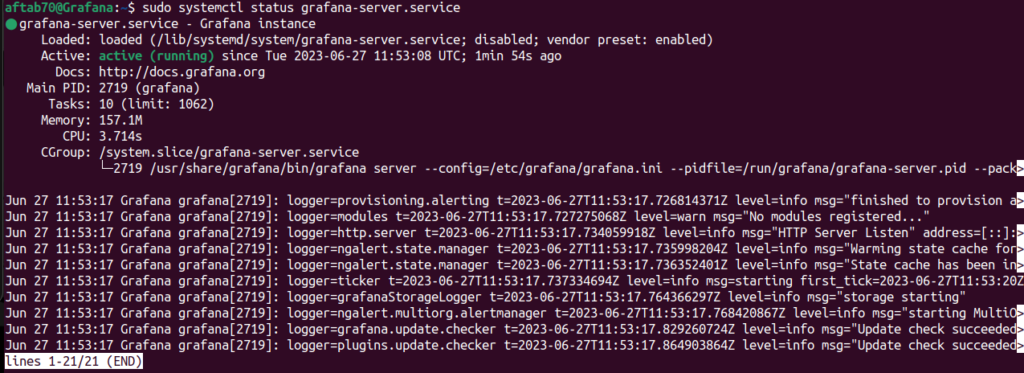
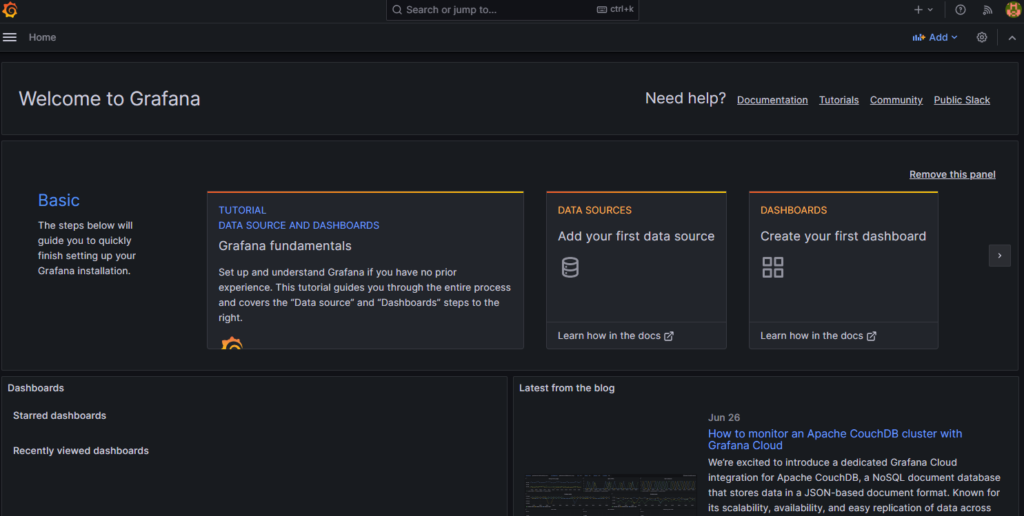
Step 7: Access Grafana Portal
At this point, Grafana 10 should be successfully installed and running on your Ubuntu 22.04 system. You can access the Grafana web interface by opening a web browser and navigating to http://localhost:3000 or http://<your-server-ip>:3000 if accessing from a different machine. From there, you can configure Grafana and start creating dashboards and visualizations to monitor and analyze your data.
We should get grafana webpage like this.

Step 8: Default Credentials – Grafana
by default, Grafana can be access by given credentials and after that we can update or reset the admin user password.
Default username and password given below:
| Username | admin |
| Password | admin |
Set your own admin password here to protect Grafana.

In this screen you need to update your Grafana’s admin password.
Conclusion
We have successfully installed Grafana on ubuntu 22.04 LTS, If you still have questions, please post them in the comments section below.

clindamycin 300 mg tablet brand name
order clomid canada
antabuse australia price
where can i get accutane online