Introduction
Step 1: Installing Grafana
#!/bin/bash

sudo apt-get update
sudo apt-get install -y adduser libfontconfig1
wget https://dl.grafana.com/oss/release/grafana_10.0.1_amd64.deb
sudo dpkg -i grafana_10.0.1_amd64.deb
sudo systemctl start grafana-server.service
sudo systemctl enable grafana-server.service
sudo apt-get install prometheus -y
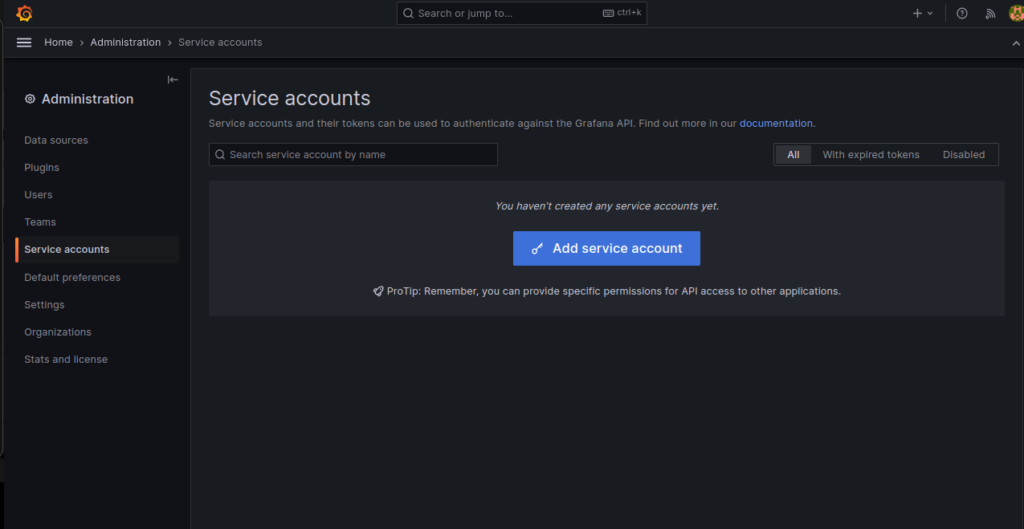
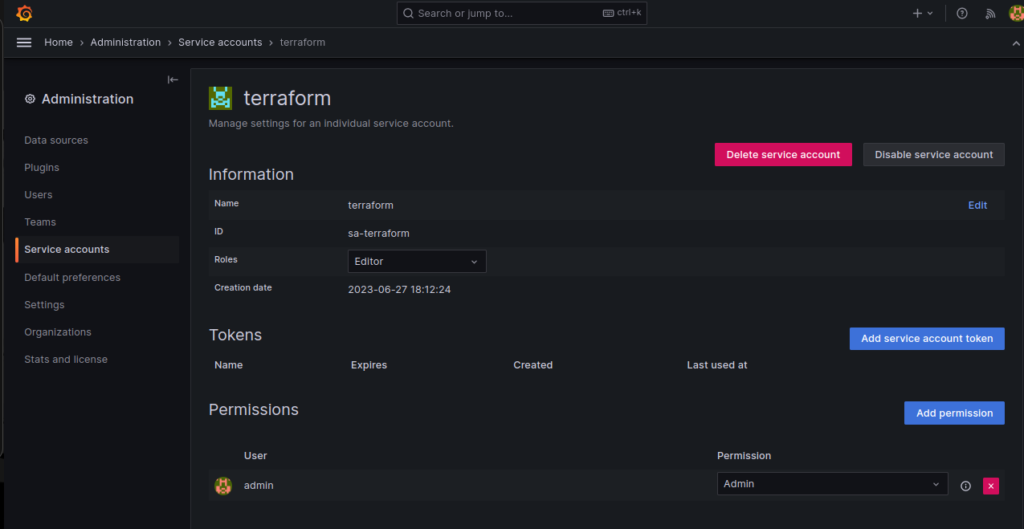
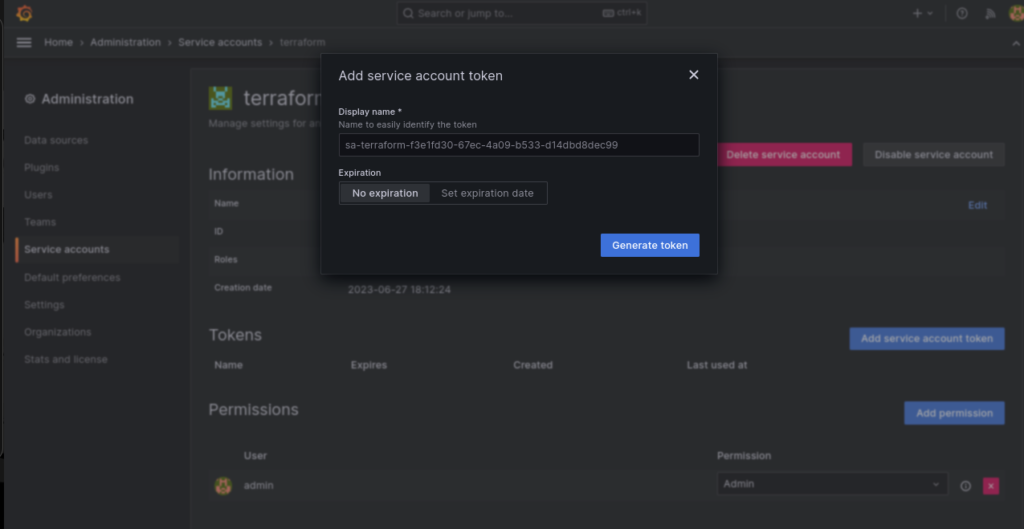
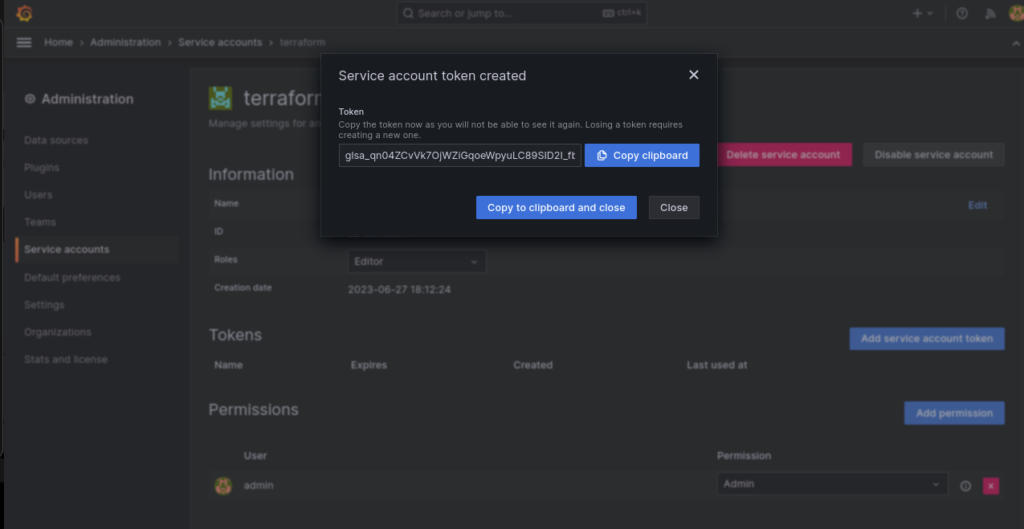
Step 2: Generate Grafana API Key
Step 3: Prepare Dashboard JSON file
From GrafanaLab we can get the prometehus based pre-define dashboard use the given link below : –
https://grafana.com/grafana/dashboards/1860-node-exporter-full/
Step 4: Installing Terraform
Step 5: Creating Terraform Config Files
.
├── dashboard.tf
├── providers.tf
└── tf_dashboard.json
To create providers.tf
nano providers.tfPaste and update your grafana endpoint with API key.
/ Update versions as appropriate for time of reading
terraform {
   required_providers {
      grafana = {
         source  = "grafana/grafana"
         version = "1.40.1"
      }
   }
}

provider "grafana" {
  url  = "http://grafana:3000/"   # Replace your with your Grafana URL
  auth = "aasfkafajbshcbjdbkhcvv" # Replace with your Grafana API key
}
Save the code.
To create dashboard.tf
nano dashboard.tfPaste the following config.
resource "grafana_dashboard" "general" {

   config_json = file("tf_dashboard.json")

}
Step 6: Deploy Dashboard using Terraform
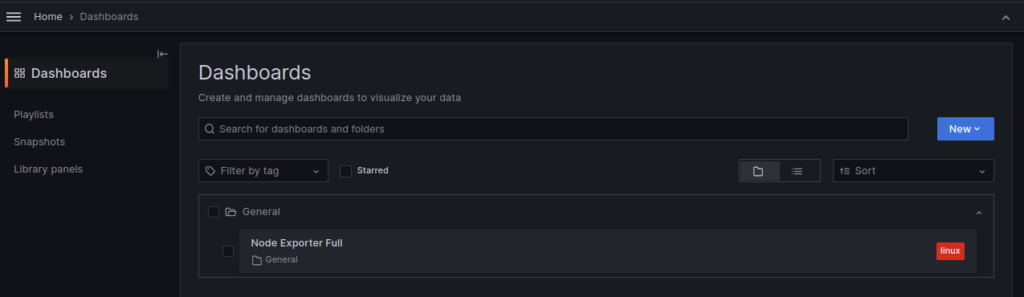
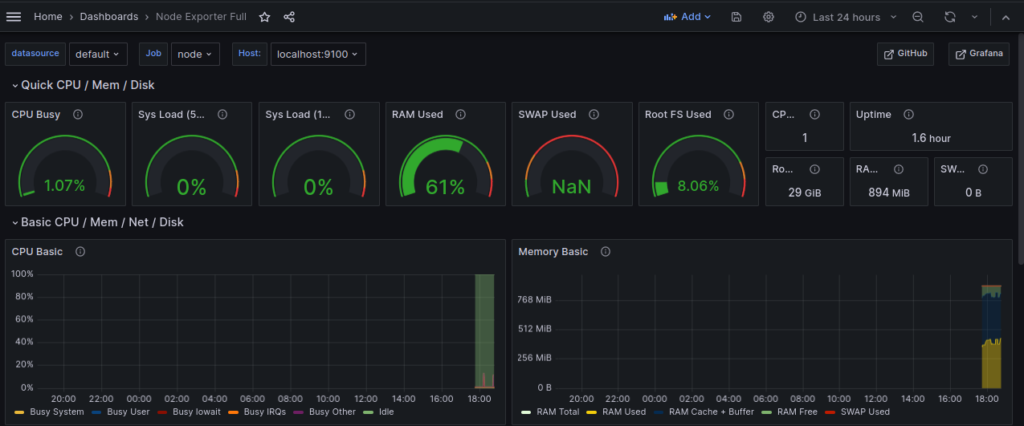
terraform init terraform planterraform apply Step 7: Verify the Dashboard
Step 8: CleanUp
terraform destroy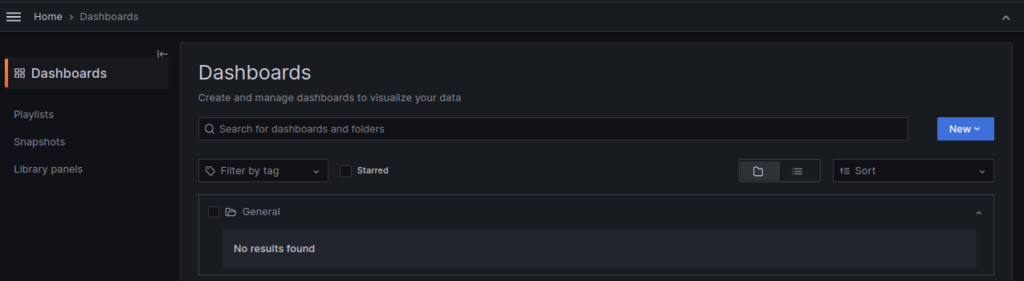
Author

Generate Grafana Dashboard using Terraform