Introduction
Blackbox Exporter is a component of the Prometheus monitoring system that allows you to perform active monitoring of network endpoints. It is designed to probe targets and collect metrics related to their availability, responsiveness, and other network-level characteristics.
The Blackbox Exporter operates by sending various types of probes to the specified targets and observing the responses. These probes can include HTTP, HTTPS, TCP, ICMP, DNS, and other protocols, depending on your configuration.
In this post, We will show you how to configure monitoring and alerting on SSL expiry / uptime using Prometheus, Blackbox, alert manager and Grafana on ubuntu 22.04 LTS.
Step 1: Installing Prometheus
Update the package list on your system by running the following command:
sudo apt-get update
Prometheus GPG key and repository already available with ubuntu 22.04 LTS, We can install the Prometheus by using apt-get command.
sudo apt-get install prometheus -y
To get prometheus service.
sudo systemctl status prometheus.service
Prometheus by default started work on port 9090, We can access the Prometheus using http://localhost:9090 or http://IP-ADDRESS:9090, Now we are good to install the blackbox packages.
Step 2: Installing Prometheus Blackbox
To install the prometheus-blackbox-exporter packages by using given command.
sudo apt-get install prometheus-blackbox-exporter
sudo systemctl status prometheus-blackbox-exporter
Configure Prometheus blackbox with given module, use the given command for the same.
sudo tee /etc/prometheus/blackbox.yml<<EOF
modules:
  http_2xx:
    prober: http
    http:
     preferred_ip_protocol: ip4
  http_post_2xx:
    prober: http
    http:
      method: POST
  tcp_connect:
    prober: tcp
  pop3s_banner:
    prober: tcp
    tcp:
      query_response:
      - expect: "^+OK"
      tls: true
      tls_config:
        insecure_skip_verify: false
  ssh_banner:
    prober: tcp
    tcp:
      query_response:
      - expect: "^SSH-2.0-"
      - send: "SSH-2.0-blackbox-ssh-check"
  irc_banner:
    prober: tcp
    tcp:
      query_response:
      - send: "NICK prober"
      - send: "USER prober prober prober :prober"
      - expect: "PING :([^ ]+)"
        send: "PONG ${1}"
      - expect: "^:[^ ]+ 001"
  icmp:
EOF
To get new configuration changes we need to restart the Prometheus Blackbox service.
sudo systemctl restart prometheus-blackbox-exporter 
We need to make sure prometheus-blackbox-exporter should in up and running condition for the same execute the given command.
sudo systemctl status prometheus-blackbox-exporter 
Step 3: Configure Prometheus
If we have the Prometheus blackbox service up and running, then we are good to add the blackbox configuration with the prometheus.yml configuration file, and here we have the basic configuration of monitoring uptime and an SSL certificate. You should replace the domains as per your needs.
Execute the given command that will append the blackbox configuration with prometheus.yml
sudo nano /etc/prometheus/prometheus.ymlPaste the following configuration and do not forget the replace the domain in order to monitored.
  - job_name: 'blackbox'
    metrics_path: /probe
    params:
      module: [http_2xx] # Look for a HTTP 200 response.
    static_configs:
    - targets:
        - https://www.devopstricks.in
        - https://www.google.com
    relabel_configs:
      - source_labels: [__address__]
        target_label: __param_target
      - source_labels: [__param_target]
        target_label: instance
      - target_label: __address__
        replacement: 127.0.0.1:9115
Save and edit from the nano editor, We are good to restart the prometheus.yml service to connect with blackbox.
sudo systemctl restart prometheus.service
After this, we also need to check the Prometheus service because if we have a misconfiguration, the Prometheus service will fail. Make sure while making changes to the Prometheus configuration, Use the given command to see the Prometheus status.
sudo systemctl status prometheus.service
Step 4: Installing Grafana 10
To save time to install and setup Grafana 10 on a Ubuntu machine, We need to use the bash script to automate a few command sequences, To create bash script, We need to execute the given command.
To create bash script.
sudo nano install_grafana.sh
Paste the following command.
#!/bin/bash

sudo apt-get update
sudo apt-get install -y adduser libfontconfig1
wget https://dl.grafana.com/oss/release/grafana_10.0.1_amd64.deb
sudo dpkg -i grafana_10.0.1_amd64.deb
sudo systemctl start grafana-server.service
sudo systemctl enable grafana-server.service
To execute the script.
sudo sh install_grafana.sh
By default, Grafana is configured with port 3000. If we have a firewall enabled, in that case, we need to open port 3000 and the TCP protocol. Access the Grafana portal by using http://localhost:3000 or http://ip-address:3000, and then update the admin user password.
Accessing Grafana Portal with http://localhost:3000

Default Creds for Grafana newly install server.
| Username | admin |
| password | admin |

Update admin password.

Grafana dashboard page.

Adding data source for Prometheus.
Go to home > connection > data sources

Click on Add data source button.

Click on Prometheus.

Add the Prometheus server URL and leave another setting as default.

Click on Save & test button, We should get successfully quired the Prometheus API.
Step 5: Importing Grafana Blackbox Dashboard
Once we get the Grafana dashboard we need to add the Prometheus database to get metrics from the agents like Prometheus-Blackbox, To do that we need to follow the given steps.
Click on import dashboard from right side + button as showing in the screenshot.

We should get import dashboard like this one, Where can use import via grafana.com or upload JSON file.

We should put the 7587 Grafana dashboard ID in order to import the Blackbox dashboard.
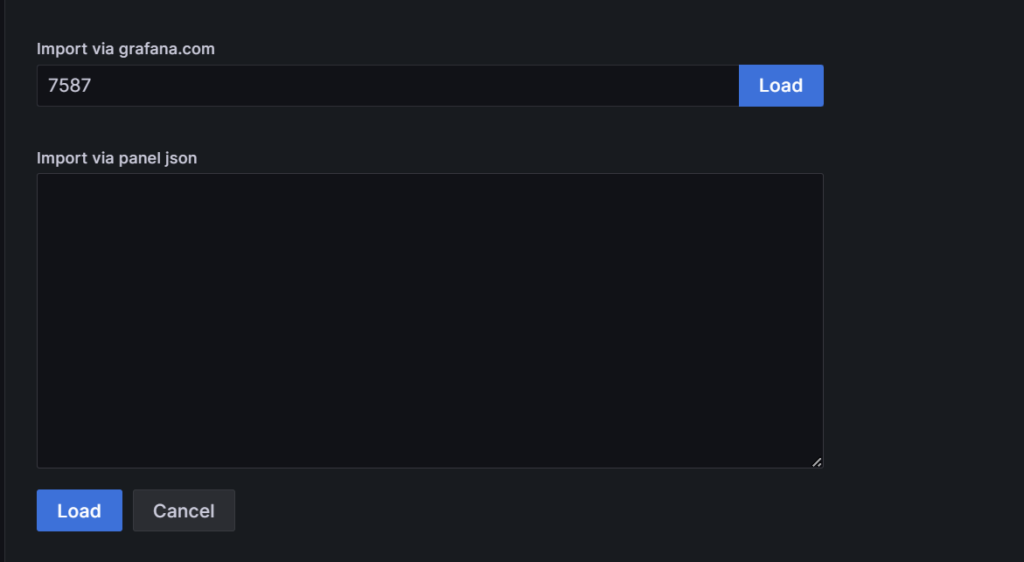
Click on Load button.

Select the Prometheus data sources for this dashboard and click on import button.

Here we will get the Prometheus Blackbox monitoring dashboard up and running, which covers website uptime, SSL certificate expiry, and DNS based monitoring.
Step 4: Setting Up Alerting
We are going to use the Prometheus alerting package in order to use create alert rule for SSL expiry and website uptime, however we can also use the use Grafana alert for the same.
To install Prometheus alertmanager.
sudo apt-get install prometheus-alertmanager -y
To validate Alertmanager service.
sudo systemctl status prometheus-alertmanager
To create black-box alerting rule.
sudo nano /etc/prometheus/blackbox-rules.ymlPaste the following alert configuration and you can update as per your needs.
groups:
  - name: Blackbox rules
    rules:
      - alert: SSLCertExpiringSoon
        expr: probe_ssl_earliest_cert_expiry - time() < 86400 * 30
        for: 1m
        labels:
          severity: warning
        annotations:
          description: "TLS certificate will expire in {{ $value | humanizeDuration }} (instance {{ $labels.instance }})"

      - alert: EndpointDown
        expr: probe_success == 0
        for: 5m
        labels:
          severity: "critical"
        annotations:
          summary: "Endpoint {{ $labels.instance }} down"
Integrate the Blackbox alert rule yml file with Prometheus under rule_file: section also check and update the alearting: section with valid alert manager URL.
sudo nano /etc/prometheus/prometheus.yml
Save and exit from the nano editor and restart the Prometheus service ti get these new changes.
sudo systemctl restart prometheusCheck Prometheus service.
sudo systemctl status prometheus
We should get Prometheus service up and running condition.
Go to the Prometheus web UI with http://localhost:9090 or http://ip-address:9090 and click on Status > Rules to see the alert rule and state for SSL expiry and uptime status.

Validate with Grafana UI, We need to go Home > Alerting > Alerting rule section from Grafana portal.

Note: Depends on the notification channel like SMTP, Slack, MS Teams, Opsgenie and other You should get an alert as per your rules.
Conclusion
We have successfully install and configure the Prometheus Blackbox with Grafana on ubuntu 22.04 LTS, Still you are having any issue, Please leave a comment below.

cheap valtrex generic
paxil 2017
Keep writing more posts on DevOps tools.
amitriptyline 2 cream
order atenolol over the counter
ampicillin coupon
3000mg valtrex
medrol buy online
rx atenolol
atenolol canada
rx albuterol
augmentin 125mg
buy elimite
piroxicam 10
can you diflucan over the counter
lioresa; without prescription
baclofen australia
phenergan 6.25 mg
canadadrugpharmacy com
triamterene-hctz 75-50 mg tab
how to buy atenolol online
suhagra tablet
can you buy phenergan over the counter
how to get fluoxetine
azithromycin 1000mg tablets
online pharmacy discount code 2018
metformin 2017
metformin online canada
lasix 20 mg tablet price
toradol for sale
order metformin on line
tamoxifen pills for sale
ivermectin 0.08
rx gabapentin
online pharmacy discount code 2018
cheap bupropion
online pet pharmacy
can i buy amoxicillin over the counter
reputable indian online pharmacy
stromectol ebay
vermox for sale
propecia over the counter usa
cialis online canada
hq pharmacy online 365
dexamethasone 5
clonidine uk
baclofen uk price
motrin 200 mg tablet
strattera 18 mg
buy cheap viagra online without prescription
mail pharmacy
effexor prescription
order dexamethasone
sildenafil 100mg price uk