Introduction
Window Node exporter is agent that collect and send the window machine hardware utilization metrics to the Prometheus server by using HTTP protocol metric, It used port 9182 by default.
Prerequisites
Up and running Prometheus server, Grafana Server in your machine / network environment or you can use the given link to setup Prometheus and Grafana on ubuntu machine to perform this window machine monitoring.
To install Prometheus – https://www.devopstricks.in/install-prometheus-on-ubuntu-22-04/
To install Grafana – https://www.devopstricks.in/installing-grafana-10-on-ubuntu-22-04-lts/
In this post, We will show you how to install window exporter on window machine to get enable monitoring like CPU, Memory, Disk Space, processes and bandwidth etc.
Step 1: Download Window Exporter Package
We need to download the window exporter package by using given link.
https://github.com/prometheus-community/windows_exporter/releases
You can choose the package as per your architecture.
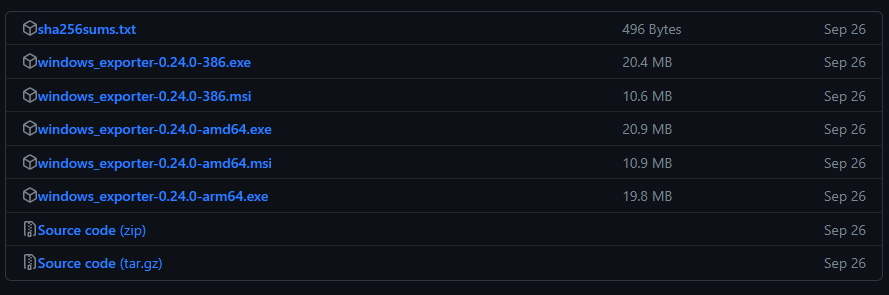
Click the download the right package, In my case i am using window 10 Prod 64 bit So then i can download windows_exporter-0.24.0-amd64.msi or windows_exporter-0.24.0-arm64.exe.
While downloading the package we should get pop-up like this, We need to click in Keep button and ignore warning that this time.

Step 2: Installing Window Exporter
After downloaded the window exporter, We need to run the package and allow the installation.
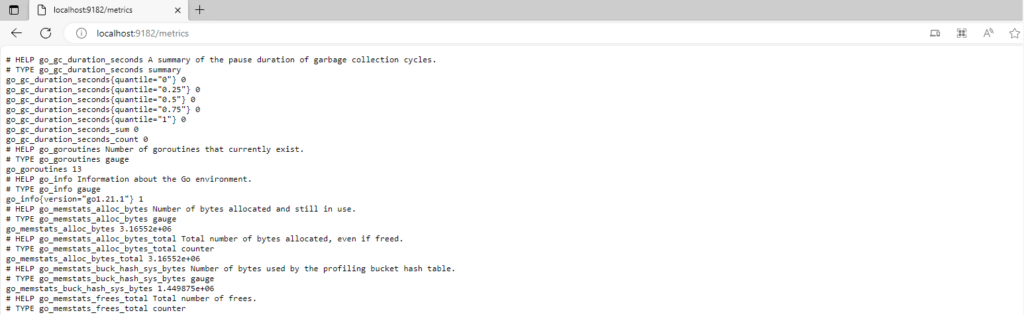
After installation of window exporter package, We need to check the followings endpoint to get window machine metrics like this.
Expose metric URL – localhost:9182/metrics
Step 3: Add Firewall Rules
We need to open the port 9182 port in your window machine and your cloud environment in order to fetch window metrics from Prometheus server.
Step 4: Configure Prometheus
We need to add the window machine endpoint to fetch metrics To do that we need to add the followings configure in Prometheus configuration file.
To open Prometheus configuration file.
sudo vim /etc/prometheus/prometheus.ymlAdd the in the last following config.
  - job_name: window
    # If prometheus-node-exporter is installed, grab stats about the local
    # machine by default.
    static_configs:
      - targets: ['Type-Window-IP-Here:9182']
This is my sample configuration file with window exporter.
# Sample config for Prometheus.

global:
  scrape_interval:     15s # Set the scrape interval to every 15 seconds. Default is every 1 minute.
  evaluation_interval: 15s # Evaluate rules every 15 seconds. The default is every 1 minute.
  # scrape_timeout is set to the global default (10s).

  # Attach these labels to any time series or alerts when communicating with
  # external systems (federation, remote storage, Alertmanager).
  external_labels:
      monitor: 'example'

# Alertmanager configuration
alerting:
  alertmanagers:
  - static_configs:
    - targets: ['localhost:9093']

# Load rules once and periodically evaluate them according to the global 'evaluation_interval'.
rule_files:
  # - "first_rules.yml"
  # - "second_rules.yml"

# A scrape configuration containing exactly one endpoint to scrape:
# Here it's Prometheus itself.
scrape_configs:
  # The job name is added as a label `job=<job_name>` to any timeseries scraped from this config.
  - job_name: 'prometheus'

    # Override the global default and scrape targets from this job every 5 seconds.
    scrape_interval: 5s
    scrape_timeout: 5s

    # metrics_path defaults to '/metrics'
    # scheme defaults to 'http'.

    static_configs:
      - targets: ['localhost:9090']

  - job_name: node
    # If prometheus-node-exporter is installed, grab stats about the local
    # machine by default.
    static_configs:
      - targets: ['localhost:9100']
  - job_name: window
    # If prometheus-node-exporter is installed, grab stats about the local
    # machine by default.
    static_configs:
      - targets: ['100.100.100.00:9182']
Save and exit from the vim text editor.
Step 5: Restart Prometheus Service
To get updated and new changes with Prometheus config file, We need to restart the Prometheus service.
To restart.
sudo systemctl restart prometheus.serviceTo check status.
sudo systemctl status prometheus.serviceWe are all good to here, Now we need to validate the window target metrics in Prometheus UI.
Step 6: Validate the Window Exporter with Prometheus
To validate the window exporter endpoint with Prometheus to know window Machin’s metric is showing with Prometheus or not.
Access to Prometheus endpoints with http://Prometheus-IP:9090
Click on status > targets
We should get output like this.
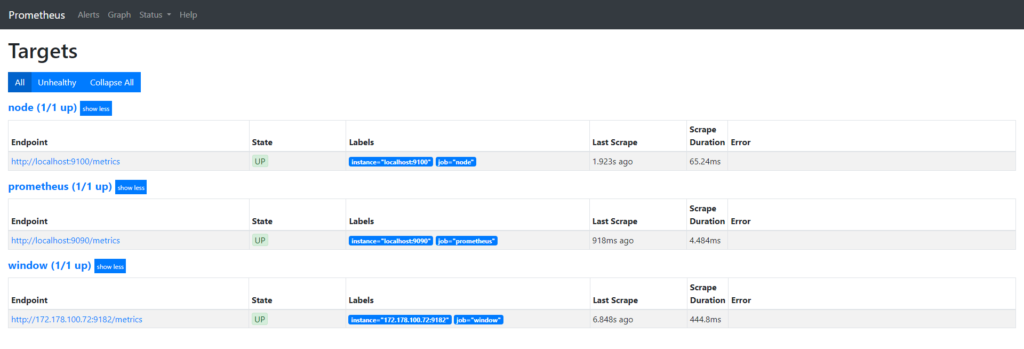
Here we can see that 1 window machine is showing that we just configured, Now we are good to use Grafana.
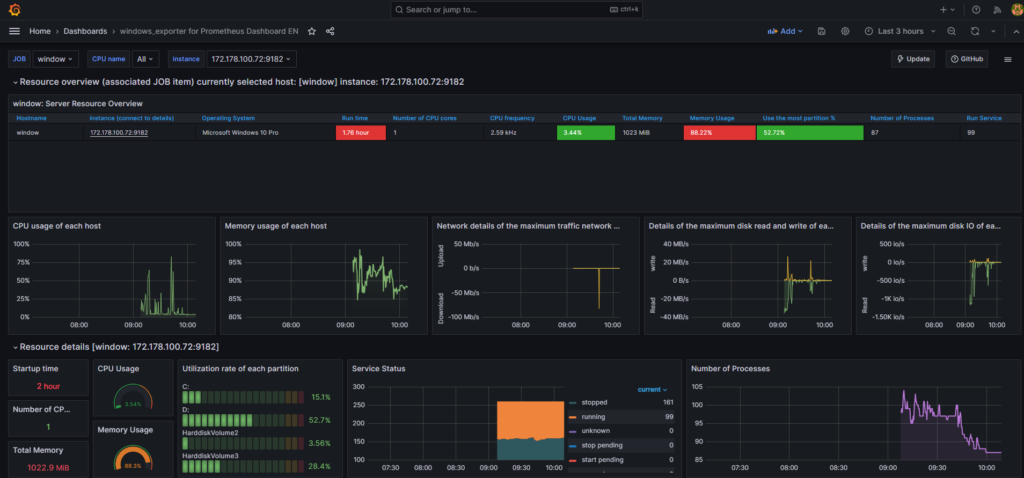
Step 7: Importing Window Node Exporter Grafana Dashboard
We use the following links to get predefine Window Node Exporter Grafana dashboard.
https://grafana.com/grafana/dashboards/14451-windows-exporter-for-prometheus-dashboard-en/ (Recommended )
https://grafana.com/grafana/dashboards/15620-windows-node-exporter/
https://grafana.com/grafana/dashboards/14694-windows-exporter-dashboard/
https://grafana.com/grafana/dashboards/18699-windows-node-exporter-full-1/
https://grafana.com/grafana/dashboards/14499-windows-node/
https://grafana.com/grafana/dashboards/14510-windows-exporter-node/
https://grafana.com/grafana/dashboards/6593-windows-node/
Conclusion
We have done successfully enabled window machine monitoring by using window node exporter, Still you are having any issue, So please leave a comment below.

augmentin 875 cost
buy accutane without prescription
buy ventolin online no prescription